Your dashboard is tracking the wrong race
The brands building durable commercial advantage are not the ones with the most sophisticated reporting. They are the ones who chose to measure the right things.
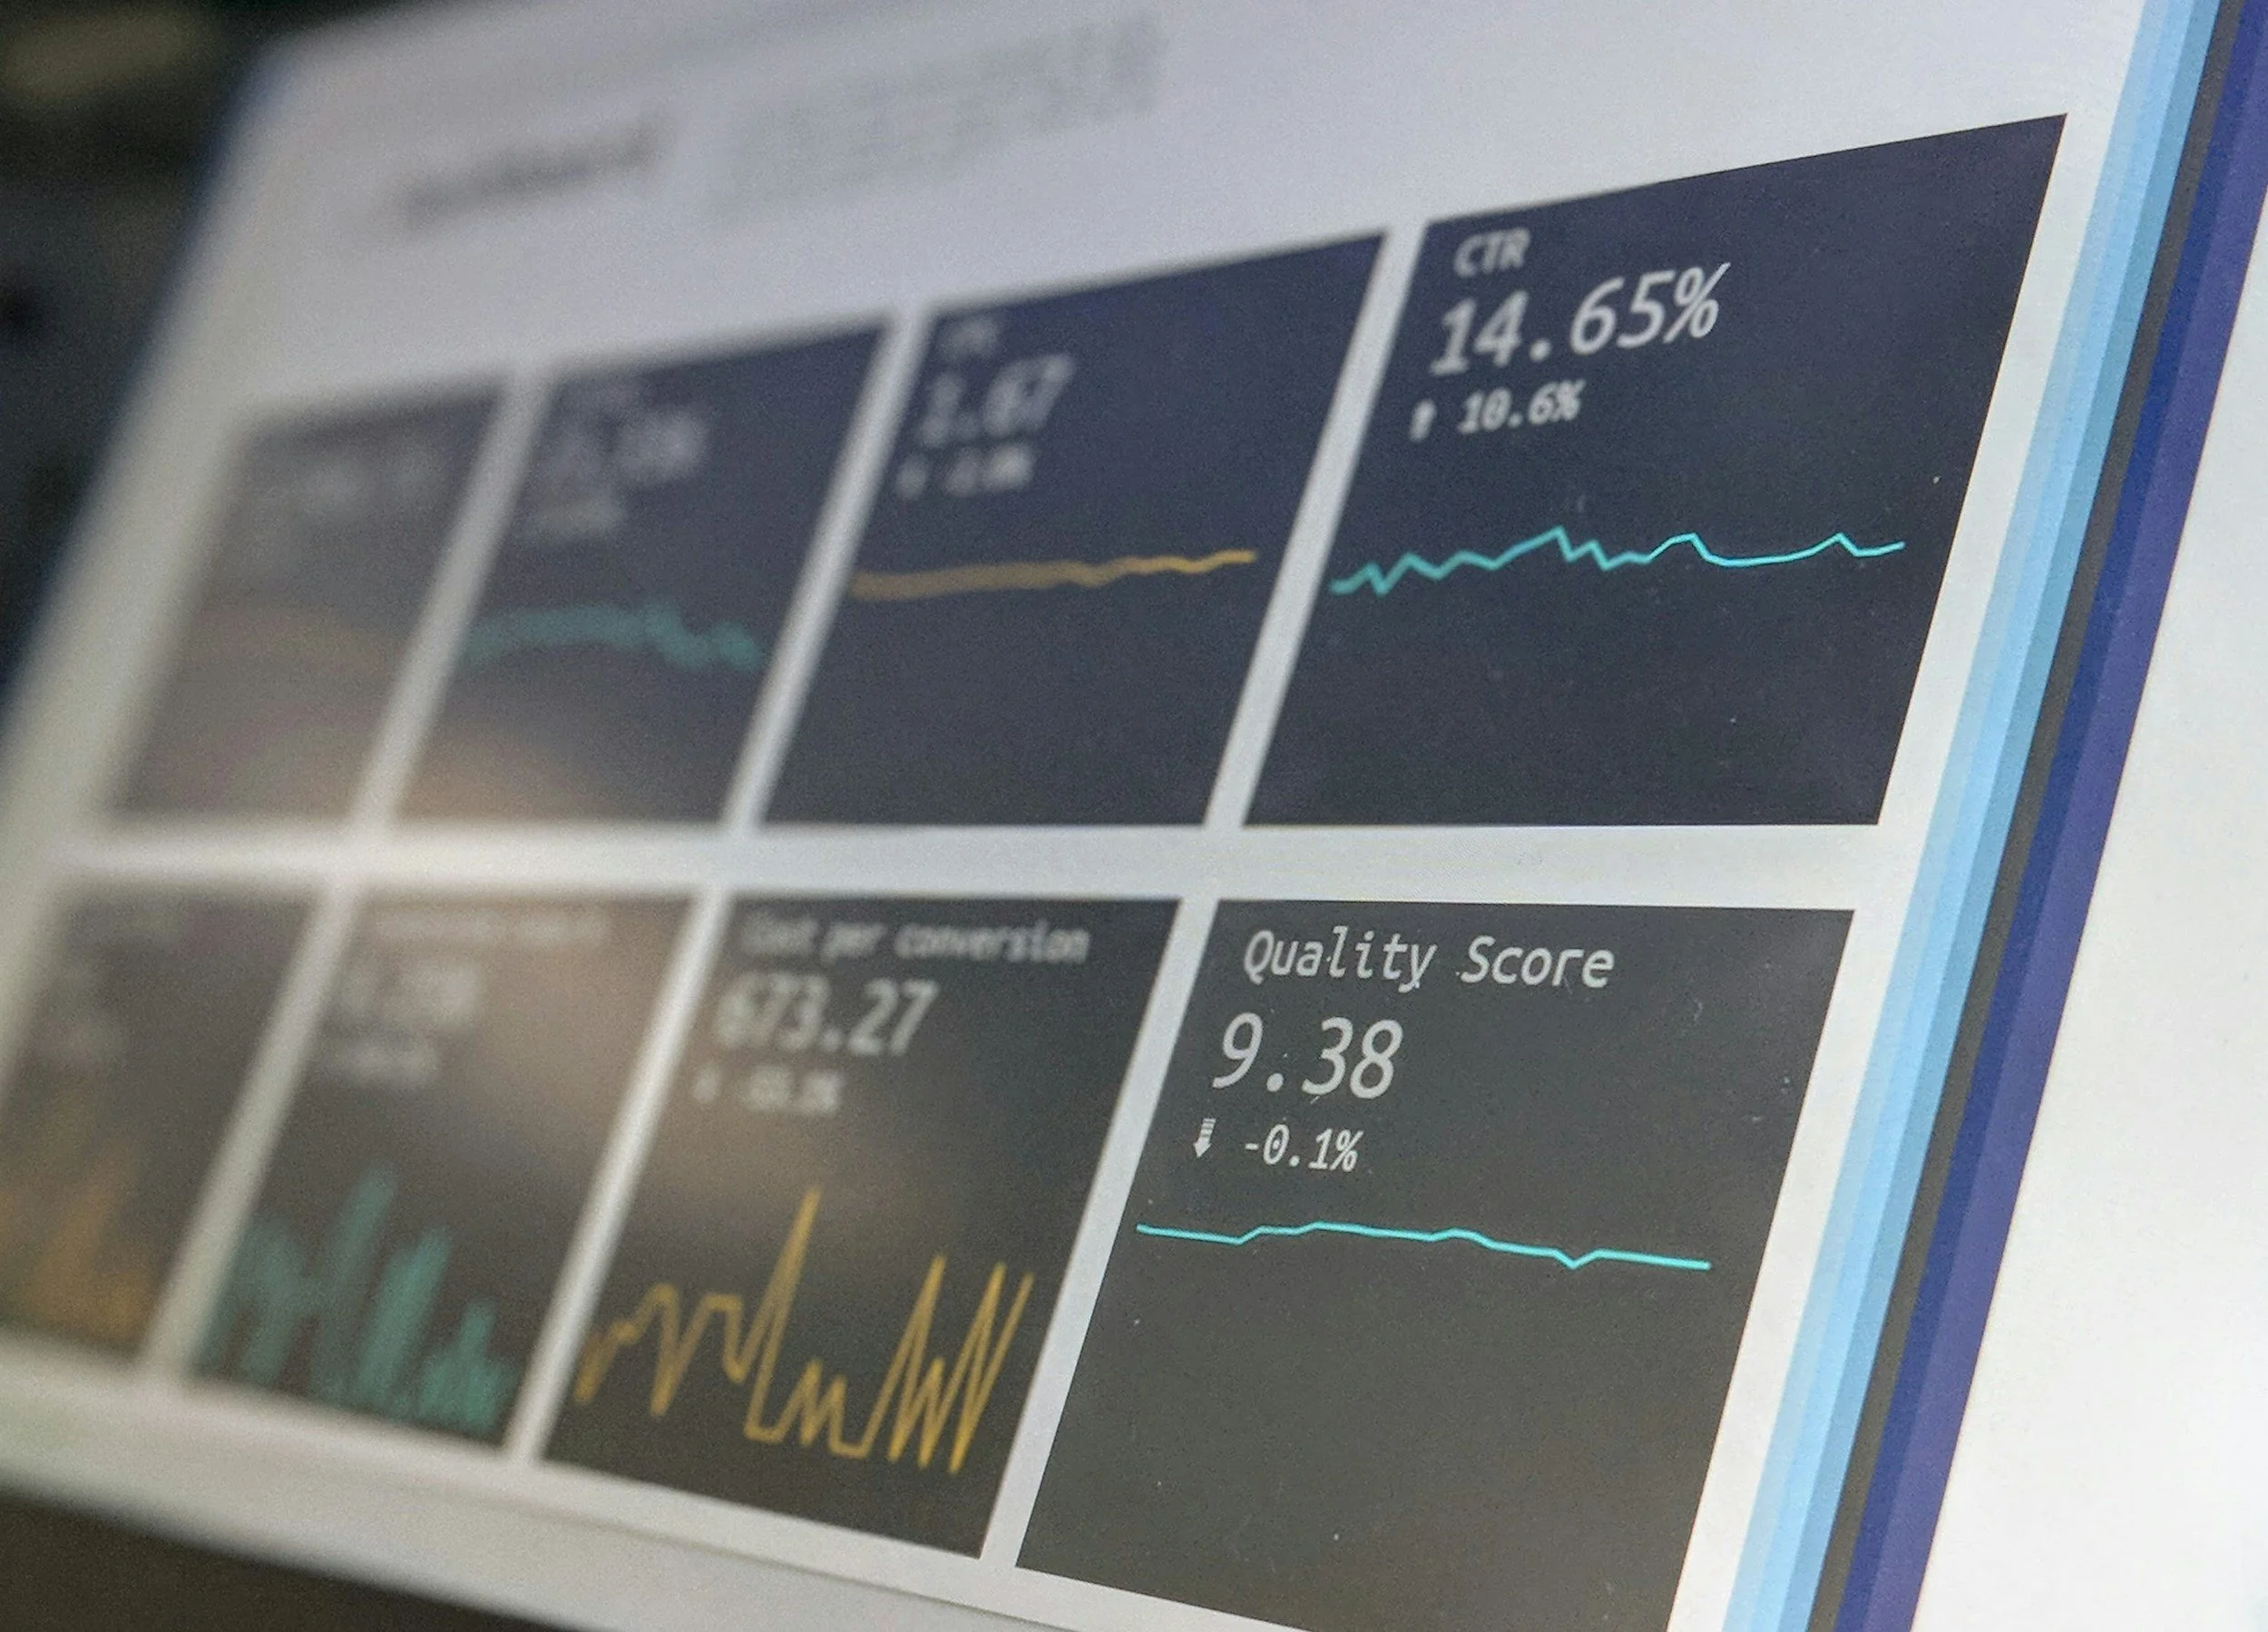
There is a specific moment in most marketing team meetings where someone shares the weekly numbers and the room relaxes.
Impressions held. Click-through rate is up. The email open rate hit its benchmark. The campaign is performing.
That relaxation is the problem.
The numbers are usually accurate. They are just describing the wrong things.
A dashboard that tells you what happened last week is not a measurement system. It is a record. And mistaking a record for intelligence is the most common and most costly error in modern marketing.
THE COMFORT TRAP
The way this happens is not through dishonesty. It is through the natural tendency to measure what is measurable, and then gradually treat what is measurable as what matters.
Click-through rate is easy to track. So teams optimise for click-through rate.
Follower growth is visible week by week. So follower growth becomes a proxy for progress.
Open rate benchmarks are established. So open rate becomes the test of whether a newsletter works.
None of these metrics are wrong. Each tells you something real.
None of them tell you whether your brand is compounding — whether the cumulative effect of everything you are doing is building trust, sharpening positioning, and narrowing the gap between where you are and where you need to be commercially.
Les Binet, speaking to Marketing Week, put the attribution problem precisely: "Attribution gives you an answer that is precise and wrong. Econometrics gives you an answer that is right." He was making a methodological argument. The principle applies much more broadly. Precision is not the same as truth. A number that moves predictably and displays cleanly in a dashboard is not automatically the number that matters.
The research confirms this pattern.
Only 23 per cent of marketing teams measure short-term and long-term outcomes in an integrated way, according to The Drum's 2026 brand planning research. The remaining 77 per cent are optimising for whichever time horizon their dashboard makes most visible, and calling it strategy.
WHAT THE MARKET IS TRACKING… ITS NOT THE DASHBOARD
While a team reviews last week's impressions, the market is tracking three things that almost never appear in a weekly report.
The first is reputation. Not awareness. Reputation. What people say about your brand when you are not in the room. Whether the association between your name and your claimed position is credible. Whether a prospect who has never seen your paid media would have heard something positive, or nothing, or something that makes them cautious. Reputation moves slowly. It is what determines whether a prospect chooses you at the end of a three-month evaluation process.
The second is trust. The cumulative signal of whether you consistently do what you say. Whether the experience matches the promise. Whether the people who use you would vouch for you unprompted. Trust compounds over years, not campaigns.
The third is pricing power. The degree to which your brand allows you to charge more than the commodity alternative. Pricing power is the ultimate test of whether a brand has built something the market genuinely values. It is almost never visible in a marketing dashboard until it begins to erode.
All three of these are affected by what you publish, what you promise, and how you behave — every week. None of them appear in last week's click-through report.
THE BRAND THAT MEASURES WHAT OTHERS HIDE
Monzo publishes its complaint data. It discloses system outages publicly. It reports real retention numbers. It does not optimise for the metrics that feel reassuring — it optimises for the metrics that tell the truth, and it builds transparency around the difficult ones.
This is not altruism. It is competitive strategy.
When a brand publishes what it finds uncomfortable, it signals something most brands cannot signal: that it trusts its customers with the truth. That signal is what builds the kind of trust that produces pricing power, retention, and compounding growth.
What Monzo chooses to make public tells you which metrics it treats as signal and which it treats as noise. The ones it publishes are the ones that, if they moved badly, would reveal a real problem. That is the definition of an intelligence metric.
A DIAGNOSTIC BEFORE YOUR NEXT REPORT
Before you open your next weekly report, identify the three metrics that appear most prominently. For each one, ask one question: if this number stayed exactly flat for the next six months, would we know we had a problem?
If the answer is no, that metric is a comfort metric. It tells you the machine is running. It does not tell you where the machine is going.
The metrics that would reveal a problem if they stayed flat are the ones worth watching. The question is whether those metrics are currently on your dashboard at all.
ONE MOVE THIS WEEK
Add one intelligence metric to your next report. Not something easy to produce — something difficult to lie to.
If you sell to businesses: the number of inbound referrals from existing customers this month, compared to the same month last year.
If you build community: the number of unprompted brand mentions in the last thirty days that you did not create, promote, or incentivise.
If you are building a brand: the time between first contact and first purchase, tracked across the last six quarters.
None of these are complex to track. All of them will tell you something your current dashboard will not.
If you want to think about measurement, momentum, and what actually builds brand equity — the newsletter goes deeper every week. Please subscribe